


ARTICLE CONTENTSOn this page 8 sections
Basic concepts in Map Reading
Performance Objectives
By the end of the lesson, students should be able to:
- identify a topographical map;
- describe types of topographical maps;
- discuss the use of scale in measurements on topographical maps;
- describe the conversion of distance and areas on a topographical map to ground distances.
Understanding Topographical Maps
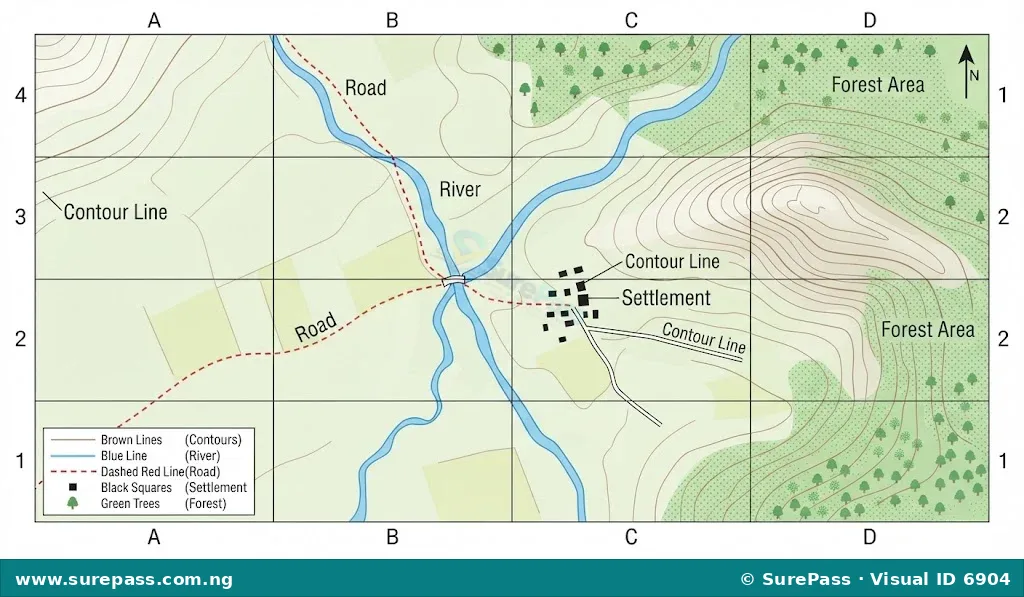
A topographical map is a detailed map that shows both natural and human-made features of a small area of the Earth’s surface. These maps use contour lines to represent elevation and relief, showing the shape and height of the land.
Topographical maps provide a comprehensive view of an area, including mountains, valleys, rivers, lakes, roads, buildings, and vegetation. They are essential tools for understanding the physical landscape and for various planning activities.
Types of Topographical Maps
Topographical maps are generally classified based on their scale, which determines the level of detail they can show. The two main types are large-scale maps and small-scale maps.
Large-Scale Maps
Large-scale maps show a small area of the Earth’s surface in great detail. The term “large scale” means that the ratio between the map distance and the ground distance is relatively large. For example, a map with a scale of 1:10,000 or 1:25,000 is considered a large-scale map.
These maps are useful for showing specific features like individual buildings, small roads, footpaths, and detailed landforms. They are commonly used for local planning, hiking, and detailed land surveys.
Small-Scale Maps
Small-scale maps show a large area of the Earth’s surface with less detail. The term “small scale” means that the ratio between the map distance and the ground distance is relatively small. For example, a map with a scale of 1:250,000 or 1:1,000,000 is a small-scale map.
These maps are suitable for showing broad geographical features such as continents, countries, large regions, major rivers, and mountain ranges. They are often used for general planning, navigation over long distances, and illustrating global patterns.
Uses of Maps
Maps serve many important purposes in daily life, planning, and administration. Some key uses include:
- Planning and Development: Maps are crucial for urban and regional planning. They help planners identify suitable locations for new roads, housing estates, schools, hospitals, and industrial areas. They also assist in assessing land use, environmental impact, and resource allocation for development projects.
- Political Boundaries: Maps clearly define political boundaries, such as international borders, state lines, local government areas, and ward limits. This helps in understanding administrative divisions and resolving boundary disputes.
- Direction and Location: Maps provide essential information for navigation, helping people find their way from one place to another. They show the relative positions of places and features, making it easier to determine routes and estimate travel times.
- Property Identification: Land ownership and property boundaries are often recorded and displayed on cadastral maps. These maps help in identifying specific plots of land, their sizes, and their legal owners, which is vital for land administration and property transactions.
- Administrative Purposes: Government agencies use maps for various administrative tasks, including population census, electoral districting, disaster management, and public service delivery. Maps help in visualising data and making informed decisions for effective governance.
Scales and Measurement on Maps
The scale of a map is the ratio between a distance on the map and the corresponding distance on the ground. It tells how much the real world has been reduced to fit on the map. Understanding map scale is essential for accurate measurement and interpretation of geographical features.
Types of Map Scales
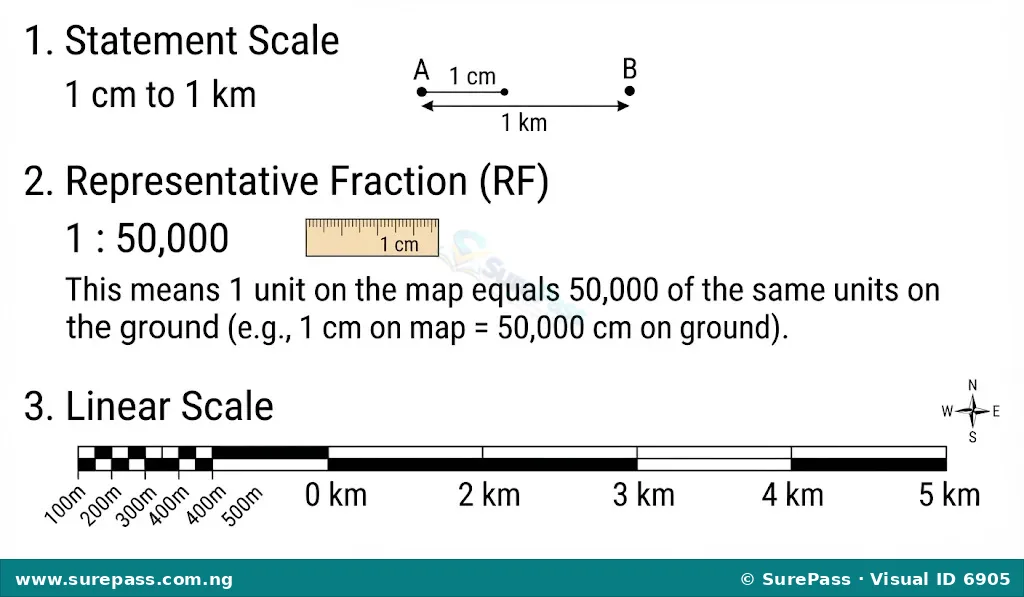
There are three main ways to express map scale:
- Statement Scale: This scale expresses the relationship between map distance and ground distance in words. It is easy to understand for general use.
Examples of statement scales include:
- 1 centimetre to 1 kilometre (1 cm to 1 km)
- 1 inch to 1 mile
This means that 1 centimetre on the map represents 1 kilometre on the actual ground.
- Representative Fraction (RF) Scale: This scale expresses the ratio between map distance and ground distance as a fraction or a ratio. Both the numerator and the denominator must be in the same unit. The numerator is always 1.
Examples of RF scales include:
- 1:10,000 (read as “one to ten thousand”)
- 1/50,000
An RF of 1:10,000 means that 1 unit of distance on the map represents 10,000 of the same units on the ground. For instance, 1 cm on the map represents 10,000 cm on the ground, or 1 metre on the map represents 10,000 metres on the ground.
- Linear Scale (Graphic Scale): This scale is a line drawn on the map, divided into segments that represent actual distances on the ground. It is a visual representation of the scale.
A linear scale remains accurate even if the map is enlarged or reduced, unlike statement or RF scales which become inaccurate if the map size changes.
Scale Conversion
It is often necessary to convert between different types of scales or to use the scale to convert map distances to ground distances.
Converting Statement Scale to Representative Fraction (RF)
To convert a statement scale like “1 cm to 1 km” to an RF, ensure both sides of the ratio are in the same unit.
Example: Convert 1 cm to 1 km to RF.
1 km = 1000 metres
1 metre = 100 centimetres
So, 1 km = 1000 x 100 cm = 100,000 cm
Therefore, 1 cm to 1 km becomes 1 cm to 100,000 cm.
The RF is 1:100,000.
Converting Representative Fraction (RF) to Statement Scale
To convert an RF like 1:50,000 to a statement scale, choose a convenient unit for the ground distance.
Example: Convert 1:50,000 to a statement scale.
This means 1 cm on the map represents 50,000 cm on the ground.
To convert 50,000 cm to metres: 50,000 cm / 100 cm/metre = 500 metres.
To convert 50,000 cm to kilometres: 50,000 cm / 100,000 cm/km = 0.5 km.
So, the statement scale can be “1 cm to 500 metres” or “1 cm to 0.5 km”.
Measuring Distances on Topographical Maps
To measure distances on a topographical map and convert them to ground distances, follow these steps:
- Identify the Scale: Note the scale of the map (statement, RF, or linear).
- Measure Map Distance: Use a ruler to measure the straight-line distance between two points on the map in centimetres or inches. For curved features like rivers or roads, use a piece of string or a flexible ruler to trace the path, then straighten the string and measure its length against a ruler.
- Apply the Scale:
- For Statement Scale (e.g., 1 cm to 1 km): Multiply the measured map distance by the ground equivalent. If you measure 5 cm on the map, the ground distance is 5 cm x 1 km/cm = 5 km.
- For RF Scale (e.g., 1:50,000): Multiply the measured map distance by the denominator of the RF. If you measure 5 cm on the map, the ground distance is 5 cm x 50,000 = 250,000 cm. Then convert this to a more practical unit like kilometres (250,000 cm / 100,000 cm/km = 2.5 km).
- For Linear Scale: Place the edge of a paper or a ruler along the linear scale to mark the map distance. Then read the corresponding ground distance directly from the scale.
Measuring Areas on Topographical Maps
Measuring areas on topographical maps involves using the map scale to convert map area to ground area.
- For Regular Shapes: If the area is a regular shape (e.g., a square or rectangle), measure its length and width on the map using the scale. Calculate the area on the map (length x width). Then, convert these map dimensions to ground dimensions using the scale and calculate the ground area.
- For Irregular Shapes (using grid squares):
- Place a transparent grid (like a graph sheet) over the area to be measured on the map.
- Count the number of full squares completely within the area.
- Count the number of partial squares that are more than half-filled by the area.
- Add the count of full squares and the count of partial squares (rounded up or down as appropriate).
- Determine the ground area represented by one grid square using the map’s scale. For example, if the map scale is 1:50,000, and each grid square is 2 cm by 2 cm on the map, then 2 cm on the map represents 2 x 50,000 cm = 100,000 cm = 1 km on the ground. So, one grid square represents 1 km x 1 km = 1 square kilometre on the ground.
- Multiply the total number of squares counted by the ground area of one square to get the total ground area.
Contour Lines
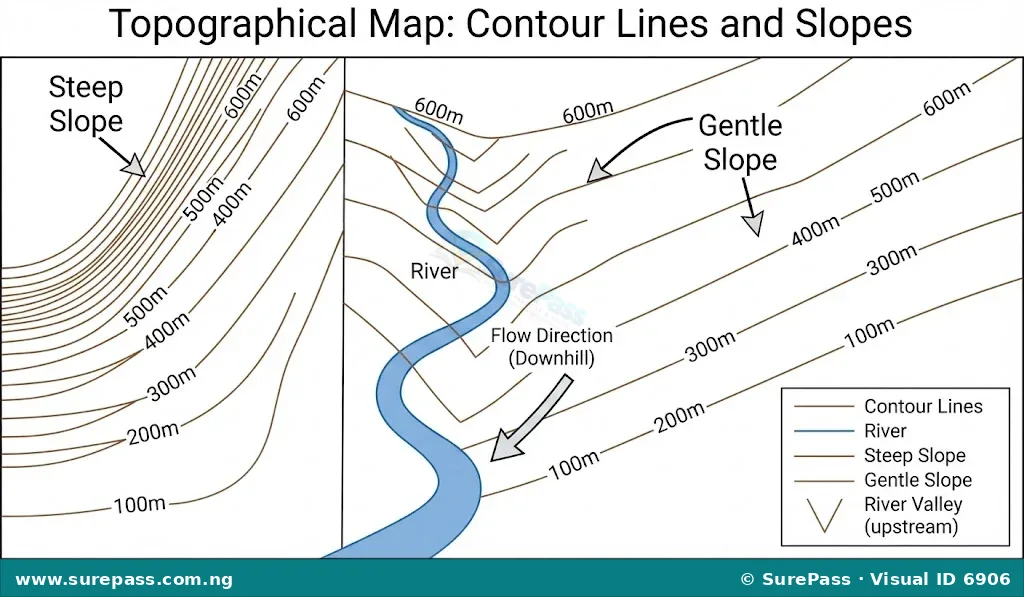
Contour lines are imaginary lines on a map that connect points of equal elevation above a reference level, usually sea level. They are the most important feature for representing relief (the shape and height of the land) on topographical maps.
Key characteristics of contour lines:
- Show Elevation: Each contour line has a specific elevation value, usually marked on the line itself or indicated in the map legend.
- Never Cross: Contour lines never cross each other, except in the rare case of an overhanging cliff, where they may appear to merge.
- Indicate Steepness:
- When contour lines are close together, they indicate a steep slope.
- When contour lines are far apart, they indicate a gentle slope.
- Show Valleys and Ridges: Contour lines form V-shapes when crossing a river or stream. The “V” always points upstream (towards higher elevation). When they form U-shapes, they indicate a ridge.
- Closed Loops: Contour lines form closed loops around hills, depressions, or mountains. A series of concentric closed loops indicates a hill or mountain, with the innermost loop representing the highest point. If the loops have hachures (short lines pointing inwards), they indicate a depression.
Drawing a Sketch Map Using a Scale
Drawing a sketch map to scale involves representing real-world features on paper while maintaining their relative positions and sizes according to a chosen scale.
The procedure involves the following steps:
- Choose a Suitable Scale: Select a scale that allows all the required features to fit on your paper while still showing enough detail. For example, if you are mapping a school compound, a scale like 1:500 or 1:1000 might be appropriate.
- Measure Ground Distances: Use a measuring tape or other tools to measure the actual distances of the features you want to include (e.g., length of a building, width of a road, distance between two points).
- Convert Ground Distances to Map Distances: Use your chosen scale to convert each measured ground distance into its corresponding map distance.
- Draw the Features: Start by drawing the main features, such as the outline of the area or major buildings, using the calculated map distances and a ruler.
- Add Details and Symbols: Include other important features like roads, paths, trees, and water bodies. Use appropriate map symbols to represent these features clearly.
- Include Map Elements: Add essential map elements such as a title, a north arrow, the scale (linear, statement, or RF), and a legend (key) explaining the symbols used.
Example: If your scale is 1:1000, and a building is 50 metres long on the ground:
50 metres = 5000 cm
Map distance = Ground distance / Scale denominator
Map distance = 5000 cm / 1000 = 5 cm
So, the building will be drawn 5 cm long on your sketch map.



0 comments
Open the discussion when you need it. Comments stay collapsed until requested so the initial article remains light.