


ARTICLE CONTENTSOn this page 5 sections
Types, Sources and Classification of Data for SS 1
Performance Objectives
By the end of the lesson, students should be able to:
- differentiate between qualitative and quantitative data;
- describe with examples structured and unstructured data;
- explain the characteristics of structured and unstructured data.
Understanding Data
In the world of digital technologies, data is a fundamental concept. It is the raw material that computers process to produce meaningful information.
Data refers to raw facts, figures, symbols, or observations that have not yet been processed or organised to reveal their full meaning. It can be anything from numbers and text to images and sounds.
For example, the number ’15’, the word ‘Lagos’, or a picture of a tree are all individual pieces of data. When these pieces are collected and processed, they can provide useful insights.
Types of Data
Data can be broadly categorised into different types based on its nature and how it can be measured or described. For SS1, we will focus on two main categories: qualitative data and quantitative data.
Qualitative Data
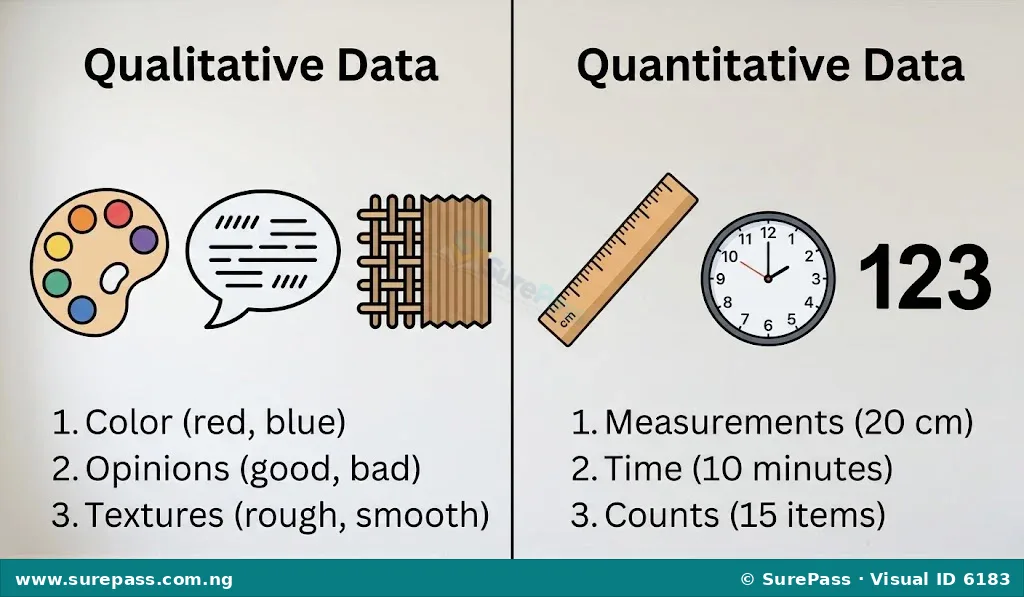
Qualitative data describes qualities or characteristics that cannot be measured numerically. It focuses on descriptions, observations, and interpretations rather than numbers.
This type of data helps to understand “why” or “how” something is the way it is. It is often collected through observations, interviews, or open-ended questions.
Examples of qualitative data include:
- Colours: The colour of a car (e.g., blue, red, black).
- Textures: The feel of a fabric (e.g., soft, rough, smooth).
- Opinions: A student’s feedback on a lesson (e.g., “The lesson was interesting,” “The teacher explained clearly”).
- Names: The names of students in a class (e.g., Amina, Chinedu, Tunde).
- Descriptions: The condition of a building (e.g., old, new, well-maintained).
Quantitative Data
Quantitative data represents quantities or amounts that can be measured and expressed numerically. It deals with numbers and can be counted or measured.
This type of data answers questions like “how many,” “how much,” or “how often.” It is often collected through surveys, experiments, or measurements.
Examples of quantitative data include:
- Age: The age of a person in years (e.g., 15, 20, 45).
- Height: The height of a building in metres (e.g., 10m, 50m).
- Number of students: The count of students in a classroom (e.g., 30, 45).
- Scores: Examination scores (e.g., 75, 88, 62).
- Temperature: The temperature of a room in degrees Celsius (e.g., 25°C, 30°C).
Differentiating Between Qualitative and Quantitative Data
The main difference between qualitative and quantitative data lies in their nature and how they are collected and analysed. Qualitative data is descriptive and non-numerical, focusing on characteristics and qualities. Quantitative data is numerical and measurable, focusing on amounts and counts.
For instance, if you describe a car as “red” and “fast,” “red” is qualitative data (a characteristic), while “fast” is also qualitative (a description of speed). However, if you state the car’s speed as “120 km/h,” that is quantitative data (a numerical measurement). Similarly, describing a student as “intelligent” is qualitative, but stating their score as “85%” is quantitative.
Structured and Unstructured Data
Another way to classify data is by its organisation and format. This leads to structured and unstructured data.
Structured Data
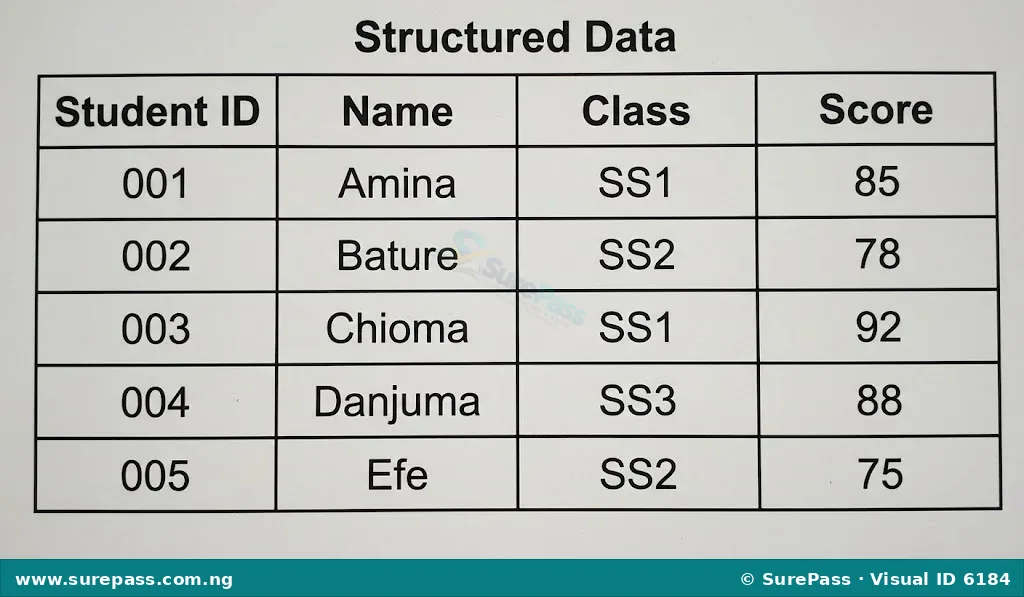
Structured data is data that is organised in a highly formatted and easily searchable manner. It typically resides in fixed fields within a record or file, making it easy for computers to process and analyse.
This type of data is usually stored in databases, where it is arranged in rows and columns, similar to a spreadsheet. Each piece of data has a clear definition and relationship to other data points.
Examples of structured data include:
- Customer records in a database: This includes names, addresses, phone numbers, and purchase history, each in its own specific field.
- Bank transaction details: Date, amount, sender, receiver, and transaction type are all stored in a fixed format.
- Student attendance registers: Names, admission numbers, dates, and attendance status (present/absent) are organised in a table.
- Product information in an online store: Product ID, name, price, and quantity available are stored in a structured way.
Characteristics of Structured Data
Structured data has several key characteristics:
- Organised Format: It is typically stored in tables, with rows and columns, or other well-defined data models.
- Predefined Schema: It follows a fixed structure or schema, meaning the type of data in each field is known in advance.
- Easy to Search and Analyse: Because of its organisation, it is easy to query, sort, and analyse using standard database tools.
- Relational: Data points often have clear relationships with each other, allowing for complex queries.
- Requires Less Storage: It can be stored efficiently due to its organised nature.
Unstructured Data
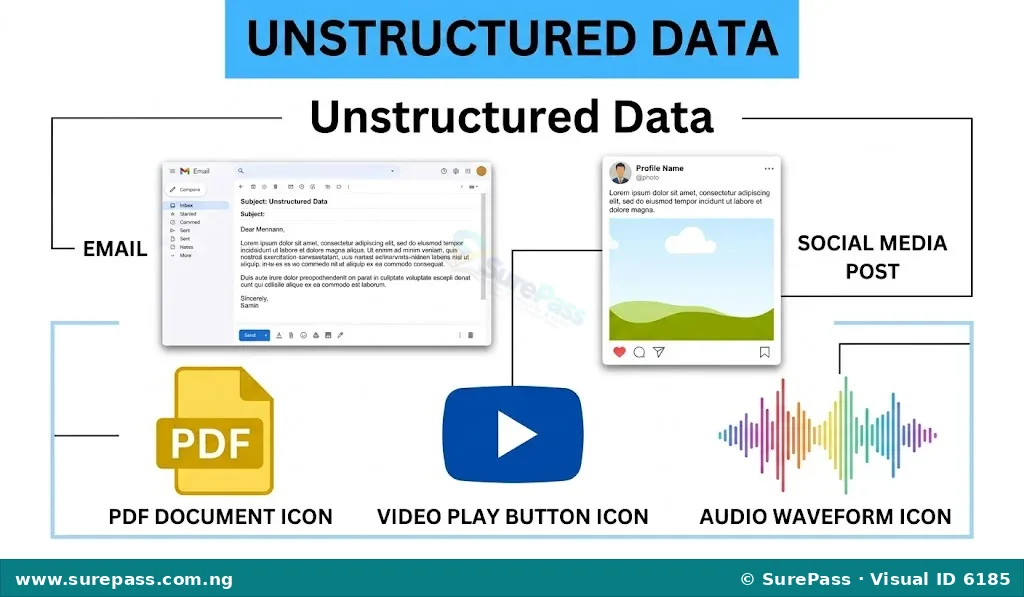
Unstructured data is data that does not have a predefined format or organisation. It is often free-form text, images, audio, or video, and does not fit neatly into traditional database tables.
This type of data is much harder for traditional computer programs to process and analyse because it lacks a consistent structure. It makes up a large portion of the data generated today.
Examples of unstructured data include:
- Emails: The content of emails, including text, attachments, and embedded images.
- Social media posts: Text, images, and videos shared on platforms like Facebook, Twitter, or Instagram.
- Documents: Word processing documents, PDFs, and presentations that contain free-form text and various media.
- Images and videos: Photos taken with a phone, security camera footage, or video clips.
- Audio files: Voice recordings, music, or podcasts.
- Web pages: The content of websites, including text, images, and links.
Characteristics of Unstructured Data
Unstructured data has distinct characteristics:
- No Predefined Format: It does not follow a fixed schema or data model.
- Difficult to Search and Analyse: Traditional database tools struggle to process and extract information from it. Specialised tools and techniques (like artificial intelligence) are often needed.
- Variety of Forms: It can be text, images, audio, video, or a combination of these.
- Large Volume: Unstructured data is generated in massive quantities daily.
- Rich in Information: Despite its lack of structure, it often contains valuable insights and context.
Importance of Unstructured Data
Even though unstructured data is challenging to manage, it is highly important in today’s digital world for several reasons:
- Rich Insights: It contains a wealth of information that can reveal customer opinions, market trends, and hidden patterns that structured data might miss. For example, analysing social media posts can show what people think about a product.
- Comprehensive Understanding: Combining unstructured data with structured data provides a more complete picture. For instance, a customer’s purchase history (structured) combined with their feedback email (unstructured) gives a deeper understanding of their experience.
- Decision Making: Businesses and organisations can make better decisions by analysing unstructured data. For example, a company can improve its products by understanding customer complaints from emails or online reviews.
- Innovation: Analysing large volumes of unstructured data can lead to new discoveries and innovations, especially in fields like scientific research and medical diagnosis.
- Customer Service: Call centre recordings (audio) and chat logs (text) are unstructured data that can be analysed to improve customer support and identify common issues.




0 comments
Open the discussion when you need it. Comments stay collapsed until requested so the initial article remains light.