


ARTICLE CONTENTSOn this page 12 sections
Entrepreneurial Finance II
Performance Objectives
By the end of the lesson, students should be able to:
- explain the meaning and purpose of break-even analysis;
- Calculate break- even point;
- Calculate profits and turnover;
- Preparing basic business records for a mock enterprise using manual and digital tools;
- Prepare a simple cash flow statement;
- discuss financial risks in entrepreneurship.
Meaning and Purpose of Break-Even Analysis
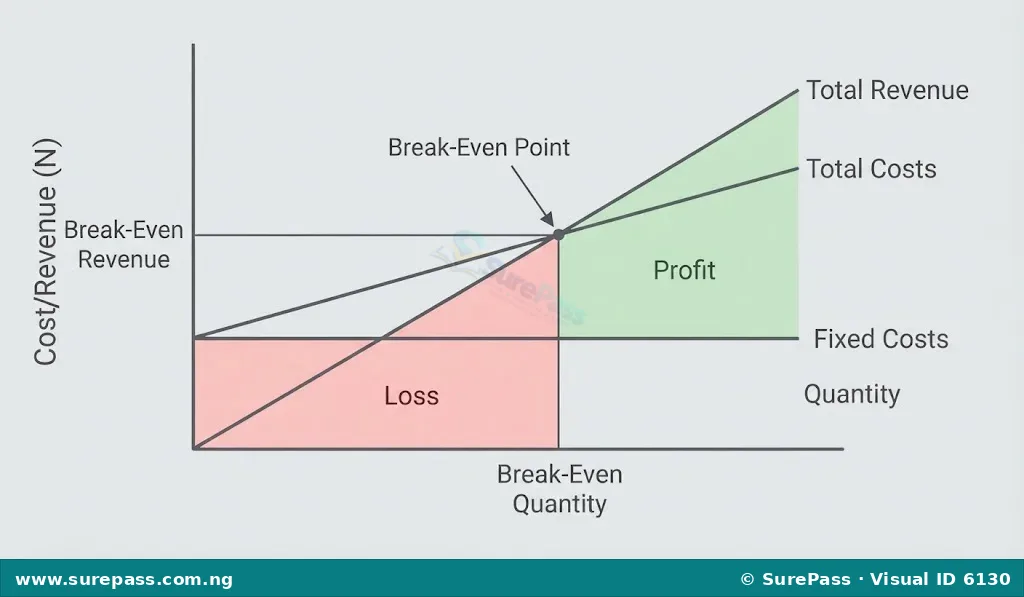
Break-even analysis is a financial tool used to determine the point at which total costs and total revenue are equal. At this point, a business makes neither a profit nor a loss. It is the minimum level of sales needed to cover all costs.
The purpose of break-even analysis is to help entrepreneurs understand the relationship between costs, sales volume, and profit. It helps in making important business decisions such as setting prices, managing costs, and planning for sales targets. By knowing the break-even point, a business can set realistic goals and identify how many units of a product or service must be sold to avoid losing money.
Calculating Break-Even Point
To calculate the break-even point, a business needs to understand its costs. Costs are generally divided into two main types: fixed costs and variable costs.
Fixed Costs
Fixed costs are expenses that do not change regardless of the level of production or sales. These costs remain constant even if the business produces more or less. Examples of fixed costs include rent for a shop, salaries of administrative staff, insurance premiums, and depreciation of equipment.
Variable Costs
Variable costs are expenses that change in direct proportion to the level of production or sales. If a business produces more, its variable costs increase. If it produces less, its variable costs decrease. Examples of variable costs include the cost of raw materials, direct labour wages for production, packaging costs, and sales commissions.
Contribution Margin
The contribution margin is the amount of money remaining from each sale after covering the variable costs. This remaining amount contributes towards covering fixed costs and generating profit. It can be calculated per unit or as a total.
The formula for contribution margin per unit is:
Contribution Margin per Unit = Selling Price per Unit – Variable Cost per Unit
Break-Even Point Formula
The break-even point can be calculated in terms of units or in terms of sales revenue.
Break-Even Point in Units
This tells a business how many units of a product or service it needs to sell to cover all its costs.
The formula is:
Break-Even Point (Units) = Fixed Costs / (Selling Price per Unit – Variable Cost per Unit)
Or:
Break-Even Point (Units) = Fixed Costs / Contribution Margin per Unit
Break-Even Point in Sales Revenue
This tells a business the total sales value it needs to achieve to cover all its costs.
The formula is:
Break-Even Point (Sales Revenue) = Fixed Costs / ((Selling Price per Unit – Variable Cost per Unit) / Selling Price per Unit)
Or:
Break-Even Point (Sales Revenue) = Fixed Costs / Contribution Margin Ratio
Where Contribution Margin Ratio = (Selling Price per Unit – Variable Cost per Unit) / Selling Price per Unit
Worked Example: Calculating Break-Even Point
A small business that sells custom-made T-shirts has the following financial information:
- Fixed Costs (rent, salaries, etc.) = N50,000 per month
- Selling Price per T-shirt = N2,500
- Variable Cost per T-shirt (material, printing) = N1,500
Let us calculate the break-even point in units and in sales revenue.
Step 1: Calculate the Contribution Margin per Unit
Contribution Margin per Unit = Selling Price per Unit – Variable Cost per Unit
Contribution Margin per Unit = N2,500 – N1,500 = N1,000
Step 2: Calculate the Break-Even Point in Units
Break-Even Point (Units) = Fixed Costs / Contribution Margin per Unit
Break-Even Point (Units) = N50,000 / N1,000 = 50 units
This means the business needs to sell 50 T-shirts to cover all its costs.
Step 3: Calculate the Contribution Margin Ratio
Contribution Margin Ratio = Contribution Margin per Unit / Selling Price per Unit
Contribution Margin Ratio = N1,000 / N2,500 = 0.4 or 40%
Step 4: Calculate the Break-Even Point in Sales Revenue
Break-Even Point (Sales Revenue) = Fixed Costs / Contribution Margin Ratio
Break-Even Point (Sales Revenue) = N50,000 / 0.4 = N125,000
This means the business needs to achieve N125,000 in sales revenue to cover all its costs.
Profit Planning
Profit planning is the process of setting financial goals for a business and developing strategies to achieve those goals. It involves forecasting sales, estimating costs, and determining the desired profit level. Effective profit planning helps a business to remain financially healthy and grow.
Key Elements of Profit Planning
- Sales Forecasting: Estimating the expected sales volume and revenue for a future period. This can be based on historical data, market research, and economic conditions.
- Cost Estimation: Projecting all costs, including fixed and variable costs, that will be incurred to achieve the forecasted sales.
- Setting Profit Targets: Defining the specific amount of profit the business aims to achieve. This could be a specific naira amount or a percentage of sales.
- Strategy Development: Creating plans to achieve the sales and profit targets. This might involve pricing strategies, marketing campaigns, cost reduction measures, or product development.
- Monitoring and Adjustment: Regularly comparing actual results with planned targets and making necessary adjustments to stay on track.
Calculating Profits and Turnover
Understanding how to calculate profit and turnover is fundamental to assessing a business’s financial performance.
Turnover (Revenue)
Turnover, also known as revenue or sales, is the total amount of money a business earns from selling its goods or services during a specific period. It is the top line figure on an income statement.
Formula for Turnover:
Turnover = Selling Price per Unit × Number of Units Sold
Cost of Goods Sold (COGS)
Cost of Goods Sold (COGS) refers to the direct costs attributable to the production of the goods sold by a company. This amount includes the cost of the materials used to create the good along with the direct labour costs used to produce the good.
Gross Profit
Gross profit is the profit a business makes after deducting the cost of goods sold (COGS) from its turnover. It shows how efficiently a business is managing its production costs.
Formula for Gross Profit:
Gross Profit = Turnover – Cost of Goods Sold
Operating Expenses
Operating expenses are the costs incurred in running a business, excluding the cost of goods sold. These include administrative expenses (like office rent, salaries of administrative staff) and selling and distribution expenses (like advertising, sales commissions, delivery costs).
Net Profit
Net profit is the final profit remaining after all expenses, including operating expenses, interest, and taxes, have been deducted from the turnover. It is often referred to as the “bottom line” and indicates the overall profitability of the business.
Formula for Net Profit:
Net Profit = Gross Profit – Operating Expenses – Other Expenses (e.g., interest, taxes)
Worked Example: Calculating Turnover and Profits
A small bakery sells bread. In a particular month, it has the following figures:
- Number of loaves sold = 1,000 loaves
- Selling Price per loaf = N800
- Cost of ingredients per loaf (variable cost) = N300
- Other direct costs per loaf (e.g., baker’s wages per loaf) = N100
- Fixed Operating Expenses (rent, administrative salaries) = N150,000
Let us calculate the turnover, gross profit, and net profit.
Step 1: Calculate Turnover
Turnover = Number of loaves sold × Selling Price per loaf
Turnover = 1,000 × N800 = N800,000
Step 2: Calculate Cost of Goods Sold (COGS)
Cost per loaf = Cost of ingredients per loaf + Other direct costs per loaf
Cost per loaf = N300 + N100 = N400
Total COGS = Cost per loaf × Number of loaves sold
Total COGS = N400 × 1,000 = N400,000
Step 3: Calculate Gross Profit
Gross Profit = Turnover – Cost of Goods Sold
Gross Profit = N800,000 – N400,000 = N400,000
Step 4: Calculate Net Profit
Net Profit = Gross Profit – Fixed Operating Expenses
Net Profit = N400,000 – N150,000 = N250,000
Record-Keeping in Business
Record-keeping is the process of systematically documenting all financial and non-financial transactions of a business. It involves collecting, organising, storing, and retrieving information about a business’s activities. Good record-keeping is essential for any business, regardless of its size.
Importance of Record-Keeping
- Decision Making: Provides accurate information for making informed business decisions, such as pricing, investment, and expansion.
- Legal and Tax Compliance: Helps businesses comply with legal requirements and tax regulations, making it easier to file tax returns and avoid penalties.
- Performance Measurement: Allows entrepreneurs to track the financial performance of their business over time, identifying areas of strength and weakness.
- Access to Finance: Well-maintained records are often required by banks and investors when a business seeks loans or funding.
- Monitoring Cash Flow: Helps in managing cash inflows and outflows, preventing cash shortages.
- Fraud Prevention: Provides a clear audit trail, which can help prevent and detect fraud or errors.
Types of Basic Business Records
Entrepreneurs need to keep various types of records to manage their businesses effectively. These records capture different aspects of business operations.
- Sales Records: Documents related to all sales made by the business. These include sales invoices, cash sales receipts, credit sales records, and daily sales summaries. They show how much revenue the business is generating.
- Purchase Records: Documents related to all purchases made by the business, whether for raw materials, inventory, or other supplies. These include purchase invoices, receipts from suppliers, and credit purchase records. They help track expenses and inventory.
- Cash Records: Documents that track all cash coming into and going out of the business. These include cash receipts, payment vouchers, bank statements, and cash book entries. They are crucial for managing liquidity.
- Inventory Records: Documents that track the quantity and value of goods held in stock. These include stock cards, inventory sheets, and records of goods received and goods issued. They help manage stock levels and prevent losses.
- Payroll Records: Documents related to employee wages, salaries, and deductions. These include employee time sheets, salary registers, and payment slips. They ensure accurate payment to staff and compliance with labour laws.
- Asset Records: Documents that track the business’s assets, such as equipment, vehicles, and property. These include purchase documents, depreciation schedules, and maintenance records. They help manage the value and condition of assets.
- Expense Records: Documents for all other operating expenses not directly related to sales or purchases, such as utility bills, rent receipts, and advertising invoices.
Tools for Record-Keeping: Manual and Digital Methods
Record-keeping can be done using traditional manual methods or modern digital tools, each with its own advantages.
Manual Methods of Record-Keeping
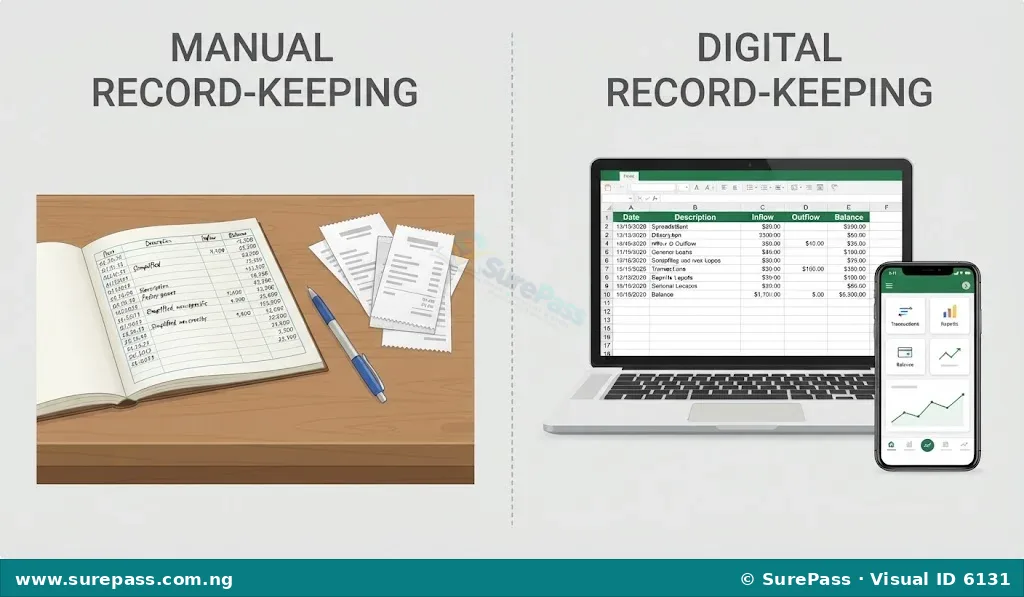
Manual record-keeping involves using physical documents, ledgers, and files to record business transactions. This method is often used by very small businesses or startups with limited resources.
- Notebooks/Ledgers: Simple exercise books or specially designed accounting ledgers are used to record daily transactions like sales, purchases, and cash movements.
- Receipt Books: Pre-printed books used to issue receipts for cash received or payments made.
- Invoice Books: Used to issue invoices for goods sold on credit or services rendered.
- Files and Folders: Physical storage for invoices, receipts, bank statements, and other paper documents.
Advantages of Manual Methods:
- Low cost, as it primarily requires stationery.
- Easy to understand for those without computer skills.
- Less prone to technical issues like software crashes or power outages.
Disadvantages of Manual Methods:
- Time-consuming and prone to human errors.
- Difficult to analyse data quickly or generate reports.
- Physical records can be lost, damaged, or stolen.
- Requires significant storage space.
Digital Methods of Record-Keeping
Digital record-keeping involves using computer software, online platforms, or electronic devices to record and manage business data. This method is becoming increasingly popular due to its efficiency and accuracy.
- Spreadsheet Software (e.g., Microsoft Excel, Google Sheets): Used to create custom templates for tracking sales, expenses, inventory, and other financial data. It allows for calculations and basic data analysis.
- Accounting Software (e.g., QuickBooks, Sage, Zoho Books): Specialised software designed for managing all aspects of business accounting, including invoicing, payroll, bank reconciliation, and financial reporting.
- Cloud-Based Accounting Platforms: Online versions of accounting software that can be accessed from anywhere with an internet connection. They often offer features like automated bank feeds and mobile app access.
- Point-of-Sale (POS) Systems: Used in retail businesses to record sales transactions, manage inventory, and process payments electronically.
- Digital Scanners and Document Management Systems: Used to convert physical documents into digital files, reducing the need for paper storage.
Advantages of Digital Methods:
- Increased accuracy and reduced errors through automation.
- Saves time by automating calculations and report generation.
- Easy access to information and quick data analysis.
- Enhanced security through backups and password protection.
- Reduces physical storage space.
- Facilitates collaboration and remote access.
Disadvantages of Digital Methods:
- Requires initial investment in software and hardware.
- Needs basic computer literacy and training.
- Vulnerable to cyber threats, data loss if not backed up, or system failures.
- Requires regular updates and maintenance.
Preparing Basic Business Records for a Mock Enterprise
For a mock enterprise, learners can practice preparing basic business records using both manual and digital tools. This practical exercise helps in understanding the flow of transactions and the importance of accurate record-keeping.
Manual Record Preparation Example: Sales and Cash Records
Imagine a mock enterprise selling snacks. The following steps can be taken:
- Sales Receipt Book: For every sale, fill out a sales receipt. One copy goes to the customer, and the other stays in the book for the business’s records.
- Cash Book: Record all cash received (from sales) and all cash paid out (for ingredients, transport) in a simple cash book. The cash book will have two sides: one for receipts (debit) and one for payments (credit).
- Expense Vouchers: For every payment made, fill out an expense voucher and attach the original receipt.
Digital Record Preparation Example: Sales and Cash Records using a Spreadsheet
Using a spreadsheet program like Microsoft Excel or Google Sheets, a mock enterprise can set up simple digital records.
Step 1: Create a Sales Log Sheet
Create columns for: Date, Item Sold, Quantity, Unit Price, Total Sale Amount, Payment Method (Cash/Transfer).
Step 2: Create a Cash Flow Log Sheet
Create columns for: Date, Description (e.g., “Cash Sale,” “Paid for Ingredients”), Type (Inflow/Outflow), Amount, Running Balance.
Step 3: Enter Transactions
As transactions occur, enter them into the respective sheets. For example, a sale of N1,000 would be entered in the Sales Log and as an “Inflow” in the Cash Flow Log. A payment of N500 for ingredients would be an “Outflow” in the Cash Flow Log.
The spreadsheet can automatically calculate total sales, total inflows, total outflows, and the running cash balance.
Cash Flow Management
Cash flow management is the process of monitoring, analysing, and optimising the cash inflows and outflows of a business. It ensures that a business has enough cash to meet its short-term obligations, such as paying suppliers, employees, and rent. Effective cash flow management is vital for the survival and growth of any enterprise.
Importance of Cash Flow Management
- Solvency: Ensures the business can pay its bills on time, avoiding financial distress.
- Planning: Helps in forecasting future cash needs and identifying potential cash shortages or surpluses.
- Investment Opportunities: Allows the business to take advantage of investment opportunities when cash is available.
- Growth: Supports business expansion by ensuring funds are available for new projects or increased operations.
- Decision Making: Provides insights into the financial health of the business, aiding strategic decisions.
Preparing a Simple Cash Flow Statement
A cash flow statement is a financial report that summarises the amount of cash and cash equivalents entering and leaving a company. It shows how a business generates and uses cash over a period, usually a month, quarter, or year.
Components of a Simple Cash Flow Statement
- Cash Inflows (Receipts): Money coming into the business. Examples include cash sales, cash received from debtors, loans received, and owner’s capital contributions.
- Cash Outflows (Payments): Money going out of the business. Examples include cash purchases, payments to suppliers, wages, rent, utility bills, and loan repayments.
- Net Cash Flow: The difference between total cash inflows and total cash outflows. A positive net cash flow means more cash came in than went out, while a negative net cash flow means the opposite.
- Opening Cash Balance: The amount of cash the business had at the beginning of the period.
- Closing Cash Balance: The amount of cash the business has at the end of the period.
Formula for Closing Cash Balance:
Closing Cash Balance = Opening Cash Balance + Net Cash Flow
Example: Simple Cash Flow Statement for a Month
Let’s prepare a simple cash flow statement for a small business, “Grace’s Eatery,” for the month of October.
Opening Cash Balance (October 1st): N20,000
Cash Inflows during October:
- Cash Sales: N150,000
- Cash from Debtors (customers who owed money): N30,000
- Owner’s Additional Capital: N10,000
Total Cash Inflows = N150,000 + N30,000 + N10,000 = N190,000
Cash Outflows during October:
- Purchase of Ingredients: N60,000
- Wages Paid: N40,000
- Rent Paid: N20,000
- Utility Bills: N10,000
- Loan Repayment: N5,000
Total Cash Outflows = N60,000 + N40,000 + N20,000 + N10,000 + N5,000 = N135,000
Calculation:
- Net Cash Flow = Total Cash Inflows – Total Cash Outflows
- Net Cash Flow = N190,000 – N135,000 = N55,000
- Closing Cash Balance = Opening Cash Balance + Net Cash Flow
- Closing Cash Balance = N20,000 + N55,000 = N75,000
Grace’s Eatery
Simple Cash Flow Statement
For the Month Ended October 31st
| Description | Amount (N) |
|---|---|
| Opening Cash Balance (October 1st) | 20,000 |
| Cash Inflows: | |
| Cash Sales | 150,000 |
| Cash from Debtors | 30,000 |
| Owner’s Additional Capital | 10,000 |
| Total Cash Inflows | 190,000 |
| Cash Outflows: | |
| Purchase of Ingredients | (60,000) |
| Wages Paid | (40,000) |
| Rent Paid | (20,000) |
| Utility Bills | (10,000) |
| Loan Repayment | (5,000) |
| Total Cash Outflows | (135,000) |
| Net Cash Flow | 55,000 |
| Closing Cash Balance (October 31st) | 75,000 |
Financial Risks in Entrepreneurship
Financial risks are potential threats to a business’s financial health and stability. Entrepreneurs face various financial risks that can impact their ability to generate profit, manage cash flow, and sustain operations. Understanding these risks helps in planning strategies to mitigate them.
Common Financial Risks
- Lack of Capital/Insufficient Funding: This is the risk of not having enough money to start or run the business. Without adequate capital, a business may struggle to purchase inventory, pay employees, or cover operating expenses.
- Cash Flow Problems: The risk of not having enough cash to meet short-term obligations, even if the business is profitable on paper. This can happen if customers pay slowly or if there are unexpected expenses.
- High Operating Costs: The risk that the costs of running the business (rent, salaries, utilities) become too high, making it difficult to achieve profitability.
- Poor Sales/Low Demand: The risk that the business does not sell enough products or services, leading to low revenue and inability to cover costs. This can be due to market changes, competition, or ineffective marketing.
- Bad Debts: The risk that customers who bought goods or services on credit fail to pay their debts. This results in a loss of revenue for the business.
- Interest Rate Risk: If a business has borrowed money at a variable interest rate, there is a risk that interest rates might increase, leading to higher loan repayment costs.
- Economic Downturns: General economic conditions, such as a recession or inflation, can reduce consumer spending and increase business costs, negatively impacting profitability.
- Competition: Intense competition can force a business to lower prices, reduce profit margins, or lose market share, affecting its financial performance.




0 comments
Open the discussion when you need it. Comments stay collapsed until requested so the initial article remains light.